Understanding the innovation pipeline from basic research to commercialization, especially in the context of emerging technology, is a challenge. At CSET, we monitor trends in the scientific landscape with our Map of Science, which displays CSET’s research clusters and tracks clusters’ subjects, vital signs (e.g., growth rate), and top research-producing organizations and countries. Beyond research, a key step toward commercialization is patenting. Inventors file patents through a legal process to trademark a design or a product, staking a claim on a novel development or method.
To provide a window into this part of the innovation process, we created a novel approach to automatically structure CSET’s dataset of global patents into clusters.1 The clusters group patents based on three factors: patent-to-patent citations, the text used in the application, and the labels assigned by patent authorities. Our resulting patent clusters represent groupings of related patented technologies, techniques, or applications.
Using patent clusters, we can characterize and explore groups of similar patents, their connections to related research, and monitor scientific diffusion from basic research into the patent space.
Patent data can be difficult to work with. Patent text is dense and contains legal jargon, and inventors are incentivized to use language and provide information strategically in order to secure the invention from competitor infringement and defend their claim in court. In addition to complex text, the scale of patents can be tricky to work with. There are many millions of patents (CSET’s patent database contains over 130 million patents), and patents can be filed in multiple jurisdictions and languages across patent authorities with varied reporting formats.
To support discovery with patent data despite these challenges, CSET developed a cutting-edge way of mapping the global patent landscape. First, we consolidated our dataset of 130 million patents into 70 million patent families using simple family identification numbers provided by PATSTAT.2 Patent families contain multiple patent documents that represent the same invention (e.g., the same patent application filed in multiple countries, an addendum to a filed patent).
Next, we constructed a network of relatedness between patent families using three features:
- Patent title and abstract
- Patent-to-patent citations (when a patent cites prior art or related work)
- Text of the patent’s cooperative patent classification (CPC) or international patent classification (IPC) codes (numerical codes and descriptive labels assigned to a patent by a patent authority)
The two text-based features (CPC/IPC codes and titles and abstracts) were embedded using a pretrained multilingual model, which converted the text into vectors that could be compared to quantify text similarity and construct a network. To map the resulting network of patent families, we ran a clustering algorithm on the patent network.
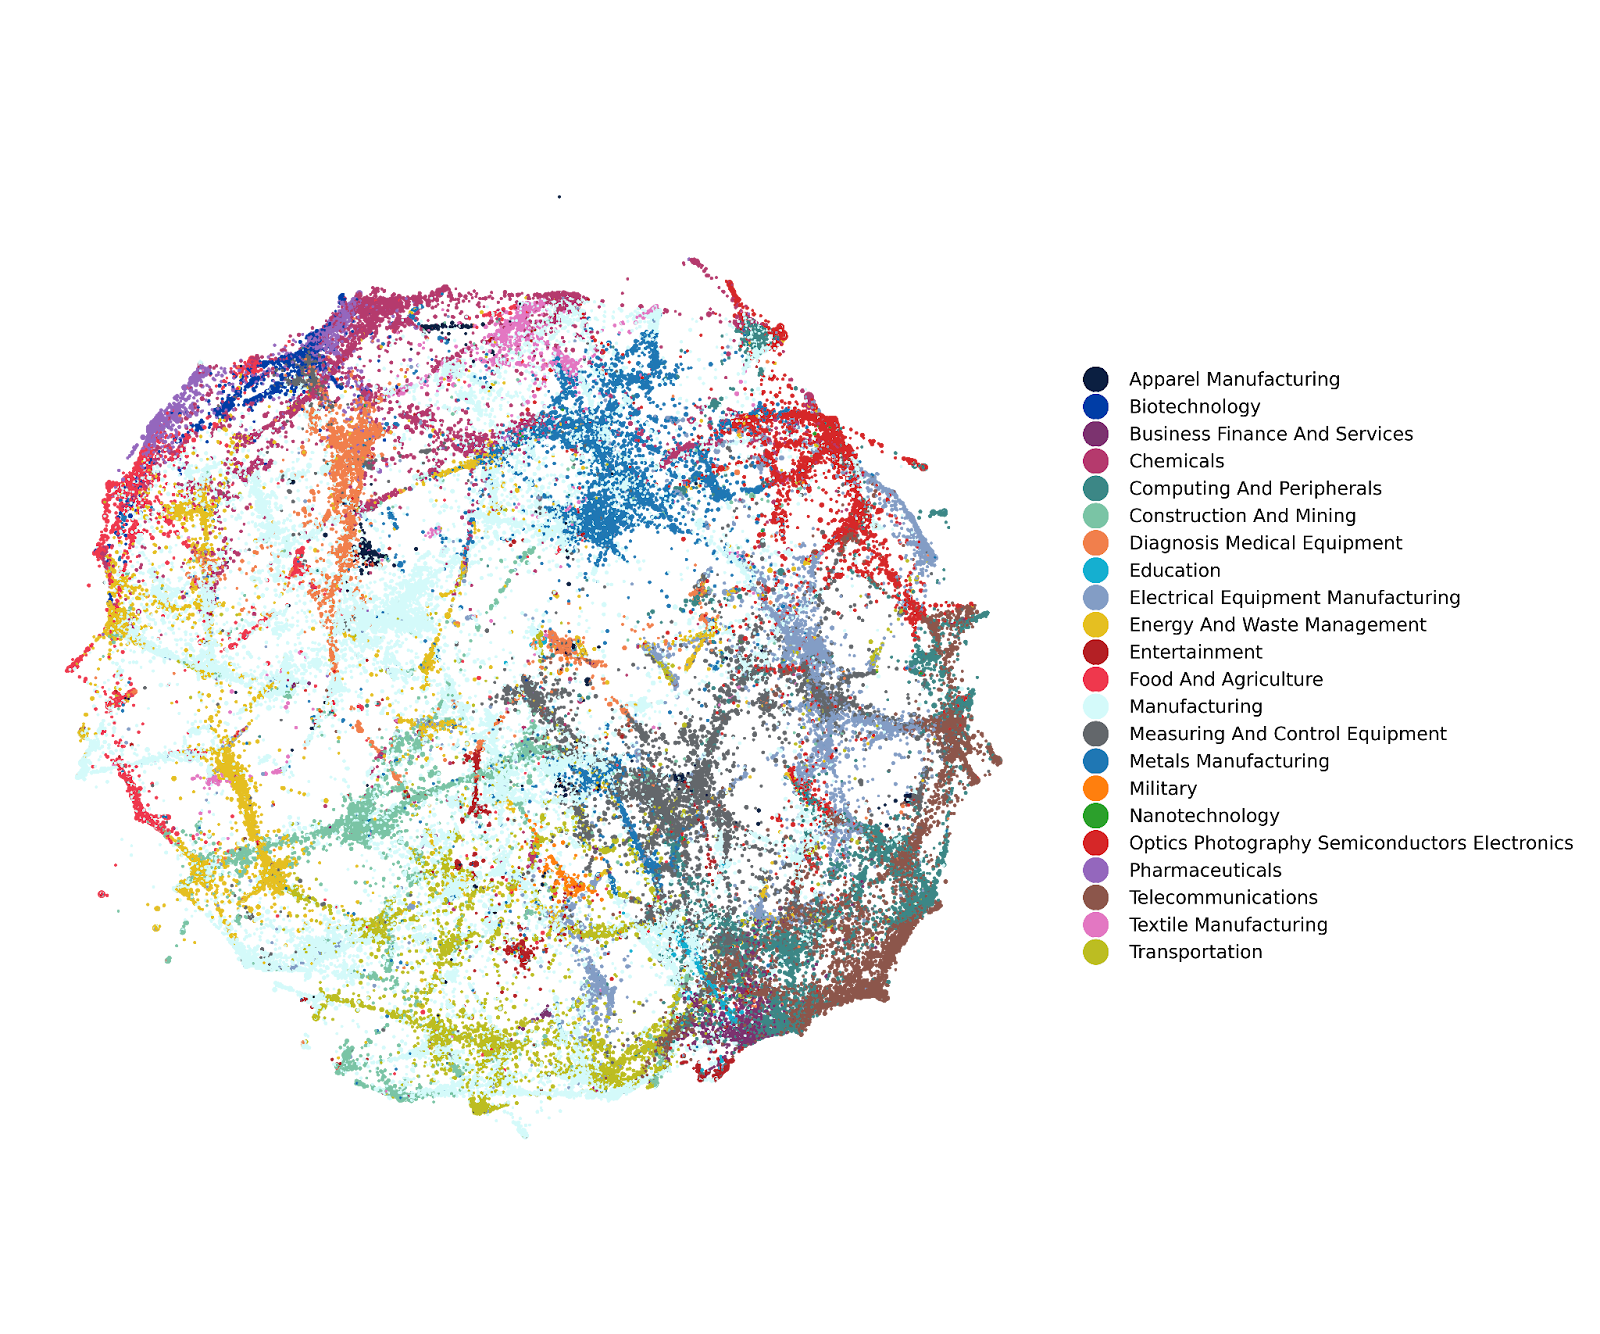
The result is 116,370 patent clusters, each composed of patents that are related through some combination of text similarity, citations, and the classification codes. As shown in Figure 1, we can color-code the clusters using CSET’s patent categories.3 CSET’s patent categories are industry-based category labels for patents and patent families derived from patent classification codes (CPCs and IPCs), which provide a broad taxonomy. These categories are based on ISIC (International Standard Industrial Classification of All Economic Activities) codes. We can also examine the clusters according to the top inventors, patent owners, classification codes, and keywords within a cluster.
Figure 1: Visualization of CSET’s Patent Clusters Colored by Patent Category
An exciting next step is to link patent clusters to fields of scientific discovery by linking CSET’s patent clusters to our Map of Science. Patents can cite publications, so for each patent cluster we can identify the research publications cited, indicating some contribution to the patented invention. We can identify those publications within CSET’s Map of Science for insight into the research-to-patent pipeline for critical technology areas.
Keep an eye out for our next data snapshot in this series, where we trace National Institute for Health-funded research through the innovation pipeline to the landscape of patents.
- CSET’s global patents dataset contains data sourced from EPO databases (www.epo.org) and the Lens Patent Records dataset (www.lens.org).
- PATSTAT, a database of patents maintained by the European Patent Organization (www.epo.org)
- CSET patent categories are industry-based labels (e.g., manufacturing) for patents and patent families derived from patent classification codes. Categories are based on ISIC (International Standard Industrial Classification of All Economic Activities) codes.