This Data Snapshot was produced as part of CSET’s PATHWISE Project. To learn more about this project, please check out the project page.
The increasing pace of AI innovation and its widespread adoption across industries generate demand for expanding the U.S.’s AI-ready workforce. Realizing this goal requires a thorough understanding of the size and composition of the current AI workforce in order to inform policies that promote workforce development and national security. Policymakers are increasingly focusing on this challenge, as demonstrated by recent Congressional hearings, as well as the recent AI Executive Order.
This data snapshot is a preliminary analysis on the latest estimates of the U.S. AI workforce using the Census Bureau’s American Community Survey (ACS) data for 2022. It also highlights the changes in the size and composition of the U.S. AI workforce since CSET’s previously published estimates for 2018.
Methodology: Defining the AI Workforce
The ACS is an annual survey, conducted by the Census Bureau, that provides timely estimates on the economic and social welfare, as well as the demographic and housing characteristics of U.S. individuals and communities. The findings in this data snapshot use the same methodology and definitions as CSET’s previous publications on U.S. AI workforce. Accordingly, the AI workforce has been distinguished into 4 occupational categories:
- Technical Team 1: occupations that are or could be actively working in AI, needed to provide technical inputs into AI applications or could laterally move into an AI development role.
- Technical Team 2: occupations that have the related knowledge, skills and abilities to perform technical roles on an AI team, either as is or with some minimal additional training
- Product Team: occupations that complement AI technical occupations in product development
- Commercial Team: occupations that provide support for the scaling, marketing or acquisition of AI at the organizational level.
Based on the aforementioned framework, the size, racial distribution and educational attainment of the AI Workforce in 2022 are discussed below.
Size of the U.S. AI Workforce
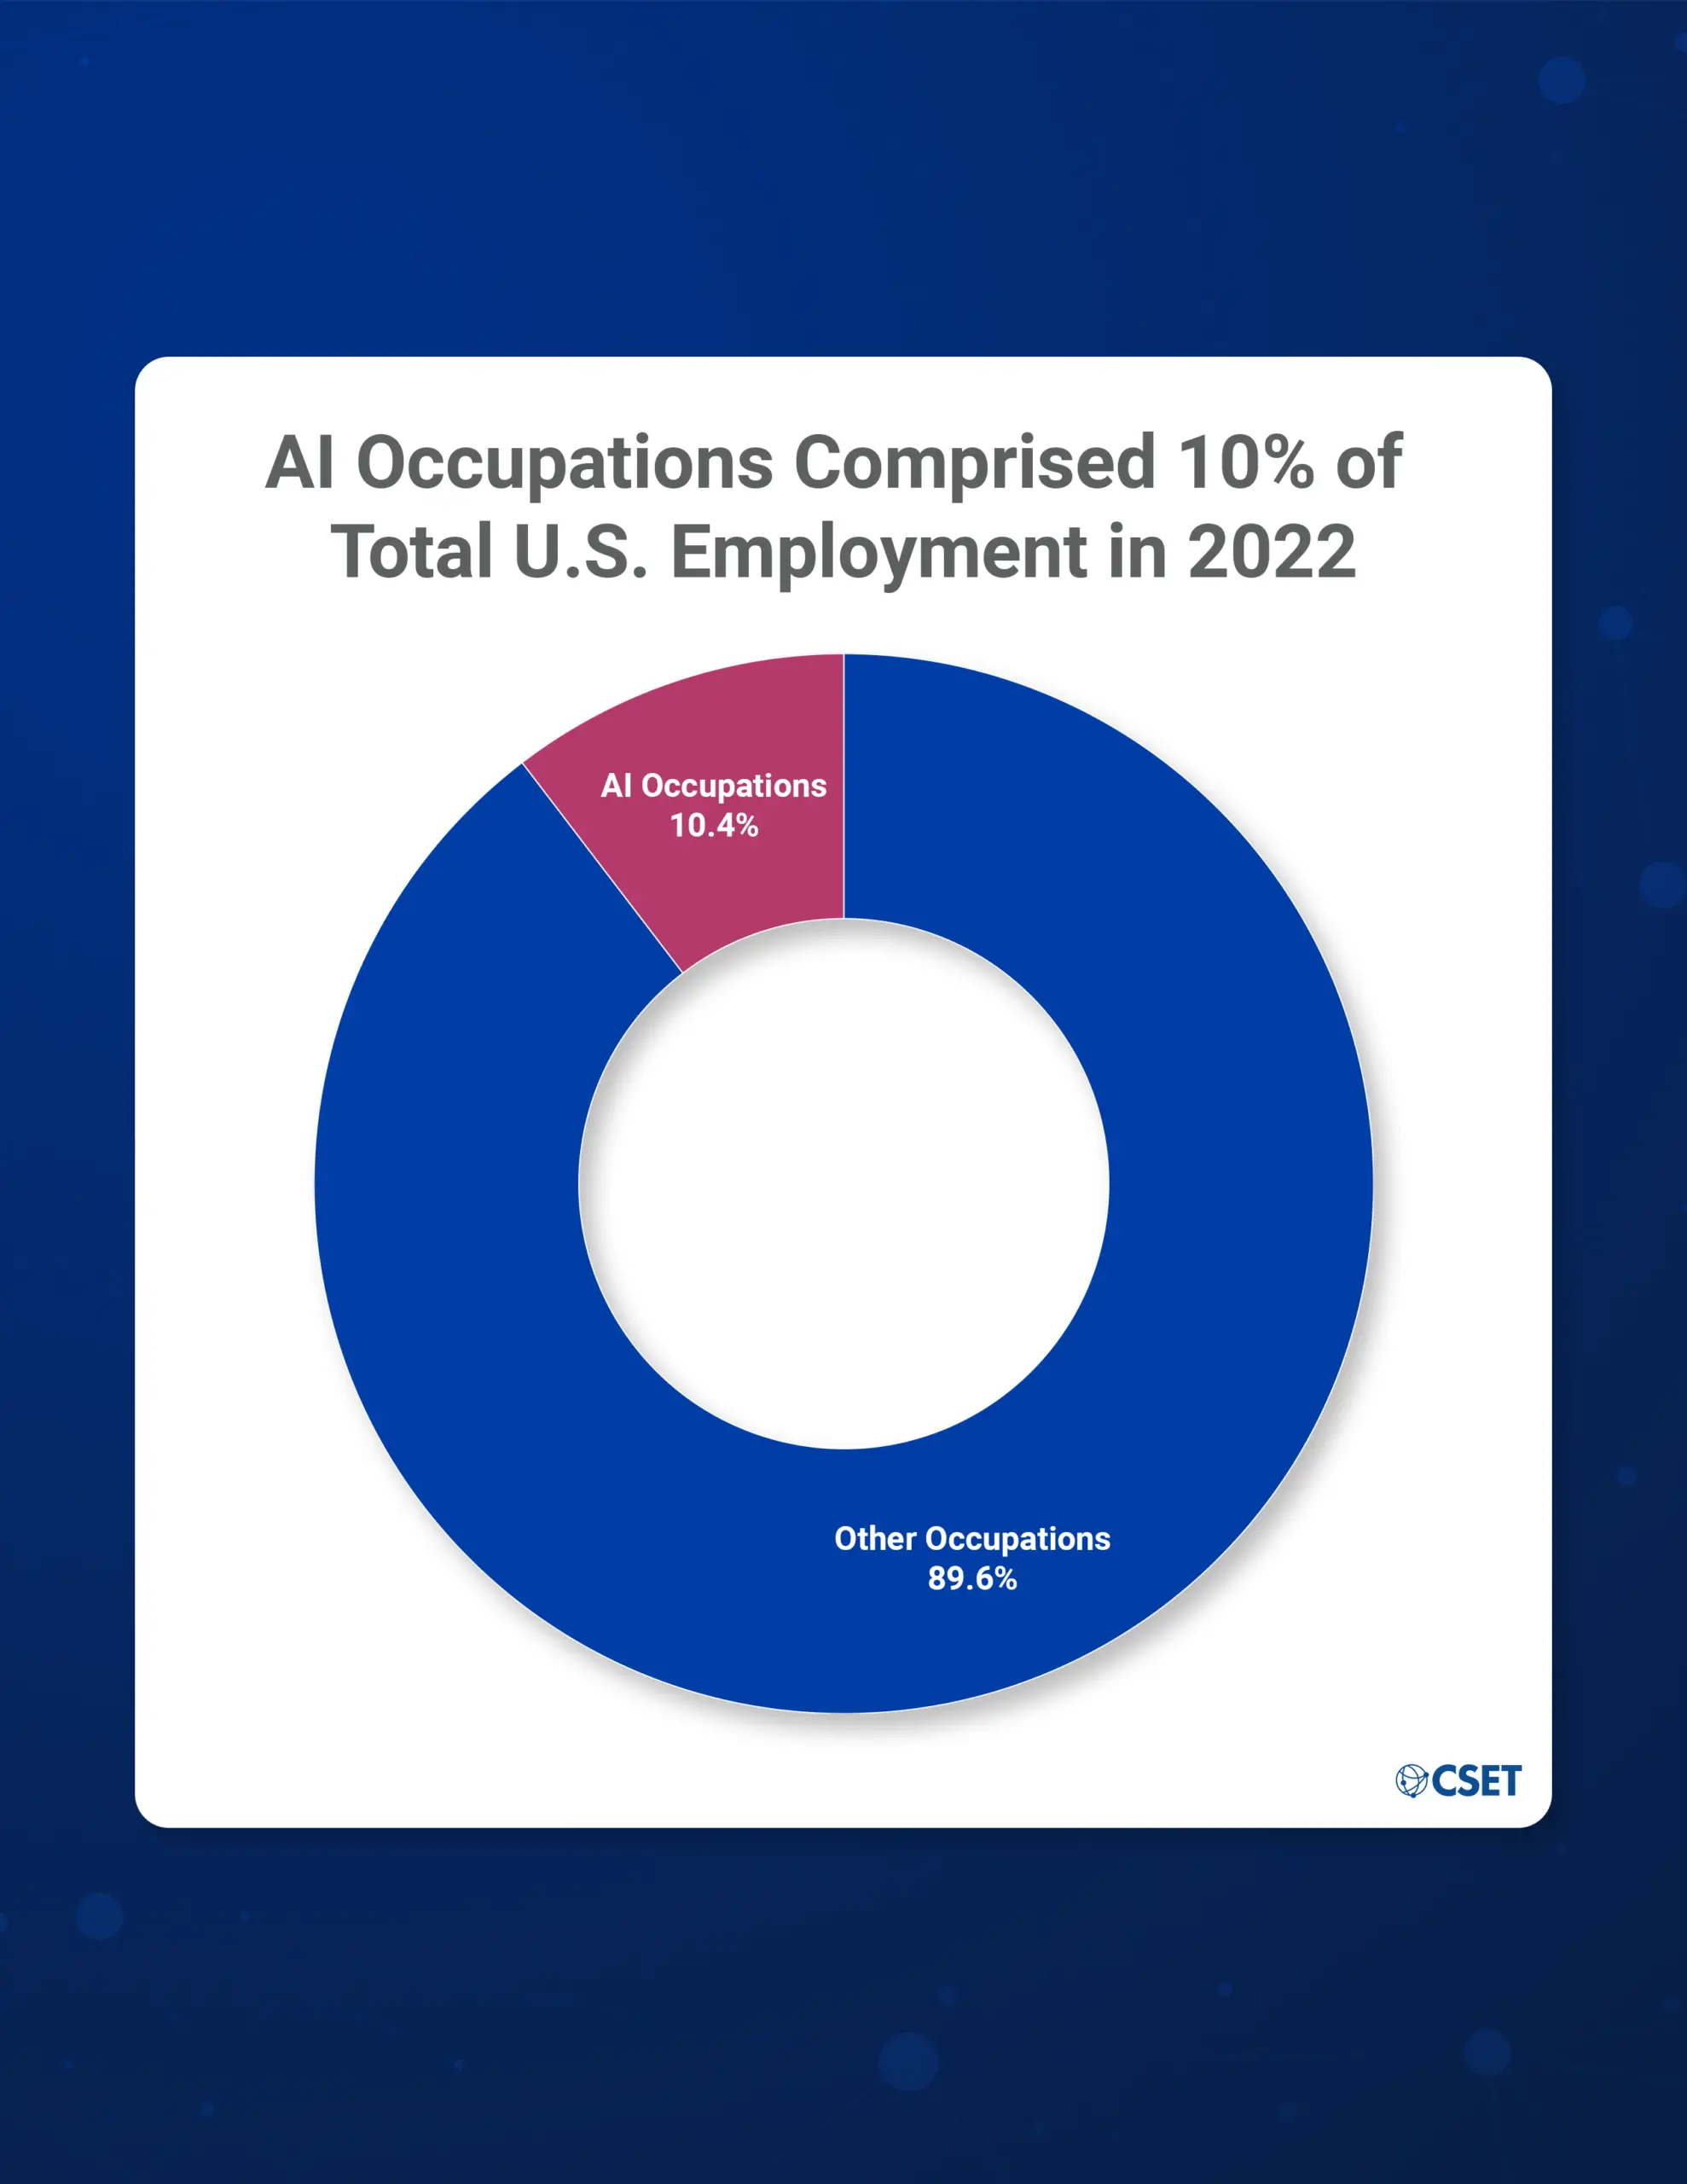
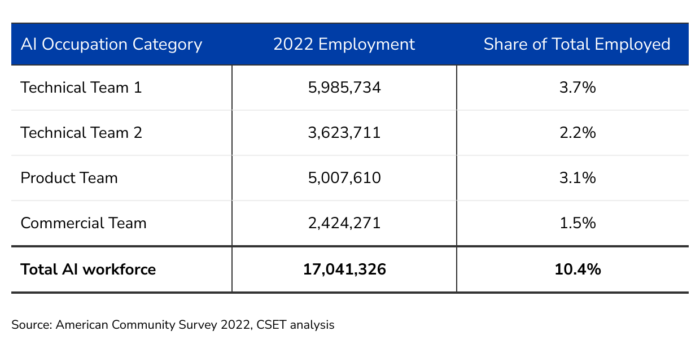
According to a CSET analysis of the ACS data, 10.4% of the U.S. workforce in 2022 worked in AI occupations. Table 1 indicates that Technical Team 1 had the highest share of employees, followed by the Product Team, Technical Team 2 and Commercial Team respectively. Technical Team 1 and Product team comprise over half of the AI workforce. This indicates that most employees in the AI workforce are either actively working in AI or supporting AI product development. While this is an increase when compared to 2018’s 8.9% of AI employees in the workforce, further analysis reveals that the increase across each category has been uneven.
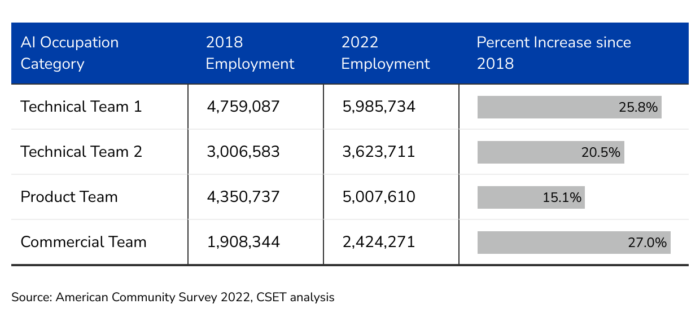
As shown in Table 2, at 27% the Commercial team had the highest percentage increase since 2018. This was closely followed by Technical Team 1, which had a slightly higher increase when compared to Technical Team 2. However, the Product Team recorded a smaller increase of only 15%.
Characteristics of the U.S. AI Workforce
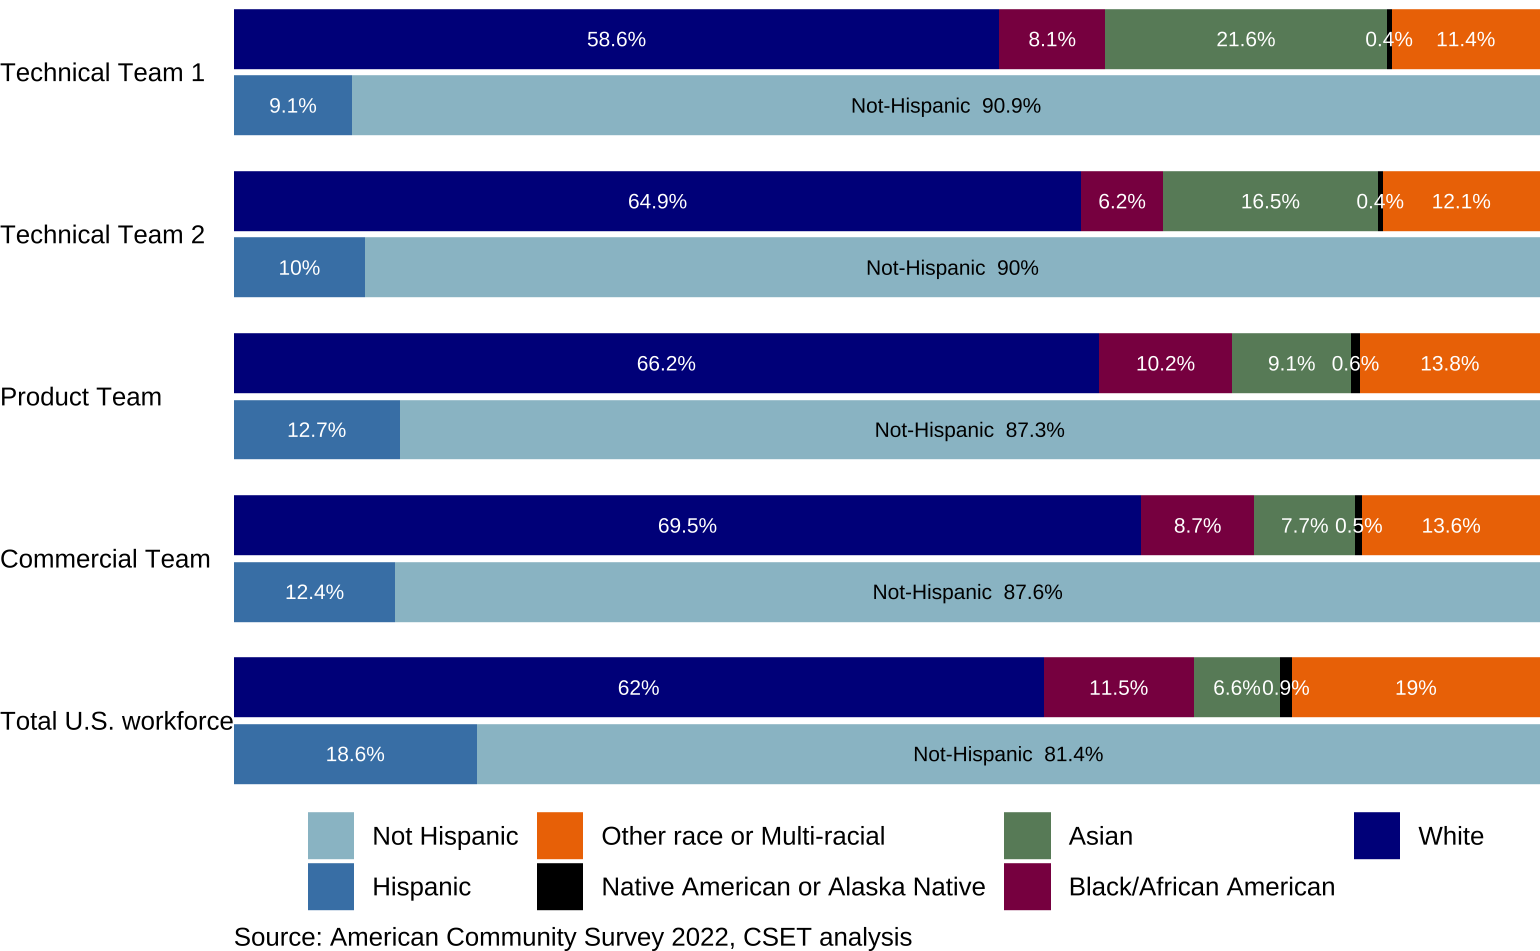
Figure 1 shows the distribution of race and ethnicity in the AI workforce, as captured by the ACS. The share of White workers is slightly higher than its share among total employed for all categories except for Technical Team 1, where it is slightly lower. The Black/African-American, Other race or Multi-racial, and Hispanic workers’ shares in all AI categories are lower than their equivalent shares among the overall U.S. workforce. In contrast, the shares of Asian workers are higher than their respective shares among the U.S. workforce.
Comparing Racial Composition of AI Workforce, 2018 v. 2022
Comparing these results with those from 2018 requires caution, as the Census Bureau has improved the questions and coding procedures for race and Hispanic ethnicity starting in 2020. These changes were aimed at improving granularity and including multiple responses for an individual.
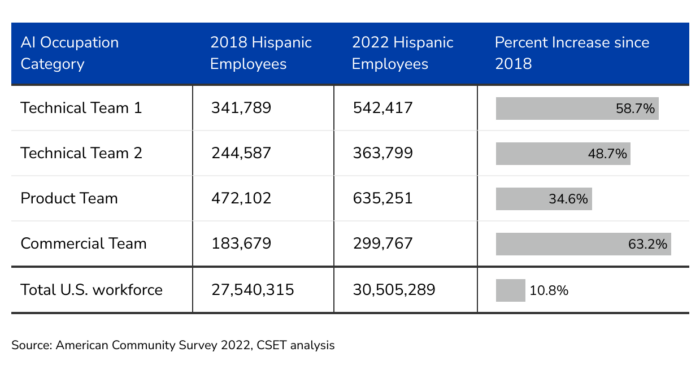
When compared to our 2018 results, Hispanic workers recorded an increased share across all AI occupation categories. As indicated in Table 3, the Commercial team experienced more than a 60% increase in Hispanic employees, which is significantly higher than the 10% Hispanic employee increase among the U.S. workforce. Both the Technical teams also recorded about a 50% increase in Hispanic employees since 2018. Notably, the Product Team’s 34% increase is much lower than that of the other categories, but still higher than in the U.S. workforce. But as noted above, these increases may partially reflect changes in how the Census Bureau elicits racial identity information.
Comparing Educational Attainment of AI Workforce, 2018 v. 2022
Figure 2 breaks down the AI workforce in 2022 by educational attainment. The majority of workers across all AI categories have at least a Bachelor’s degree. In both the technical teams, nearly 75% of workers have at least a Bachelor’s degree. In particular, they have a higher share of graduate and doctoral degree workers as compared to other categories. This is largely due to a higher concentration of STEM occupations in the technical teams.
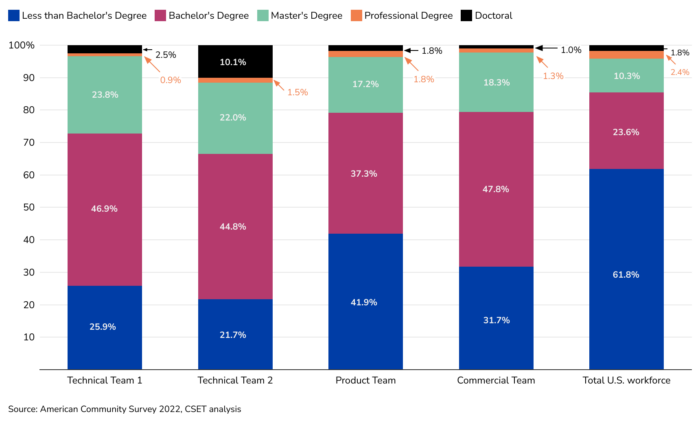
The Commercial team has over 68% of employees with at least a Bachelor’s degree, compared to 58% on the Product team. The latter has the highest share of workers with less than a bachelor’s degree, compared to the rest of the AI workforce. That being said, the share of employees with less than a Bachelor’s degree among the U.S. workforce is markedly higher than in all four AI worker categories.
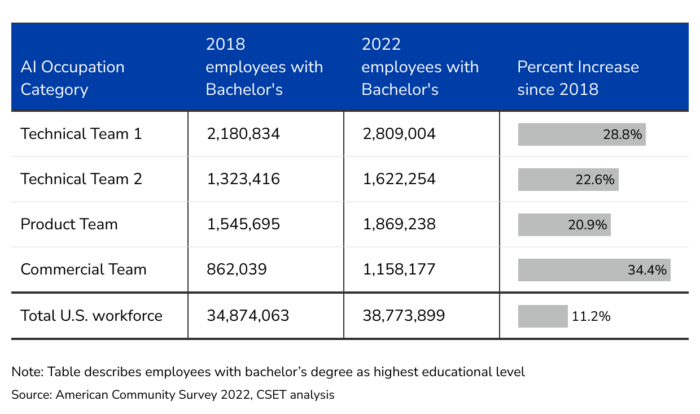
Overall, the number of AI workers with bachelor’s degrees as their highest educational attainment has increased since 2018, as shown in Table 4. In line with our previous trends, the Commercial team experienced the highest percent increase, nearing a 35% increase since 2018. All the other categories also experienced a higher percent increase in workers with Bachelor’s degrees as their highest educational level when compared to its increase in the total workforce. In contrast, the share of workers with less than a Bachelor’s degree decreased across all AI categories, in line with a similar trend among the total workforce. There were no significant changes in the distribution of AI workers with graduate, professional, and doctoral degrees between 2018 and 2022.
Conclusion
Our findings indicate that the U.S. AI workforce has grown since 2018. Moreover, the increase in Hispanic employees in the AI workforce has been much larger than its increase among the total U.S. workforce. With regard to educational attainment of the AI workforce, there is a larger share of workers reporting that their highest degree was a Bachelor’s in 2022 compared to 2018. The overall high percent increase in Commercial team employees indicates a growing importance for jobs that support the scaling, marketing and acquisition of AI at the organizational level. Additional research related to this data, as part of CSET’s PATHWISE project, will include revisiting definitions of the AI workforce, and analyzing results based on these updates. It will also include analysis on other characteristics of the U.S. AI workforce.
