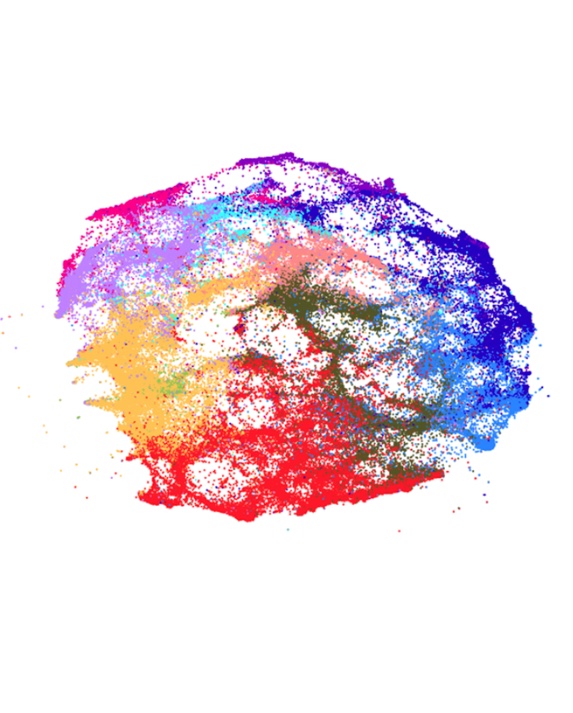
With the Map of Science1 providing a global landscape of scholarly literature, we begin to describe details about artificial intelligence research clusters in the context of all of science. Each RC has a range of details relating to features such as RC size, age, and growth. We use these features to dive deeper into the data and understand the generalities and specificities of AI research—here we begin with RC growth.
Our data provides two ways to measure RC growth: 1) historical growth and 2) forecasted growth. To compute historical growth we calculate the average annual growth over the past three years. To compute forecasted growth we implement a three-year forecasting metric2 designed for RCs that takes features such as peak year, publisher ranking of papers, and the average age of publication references as its inputs.
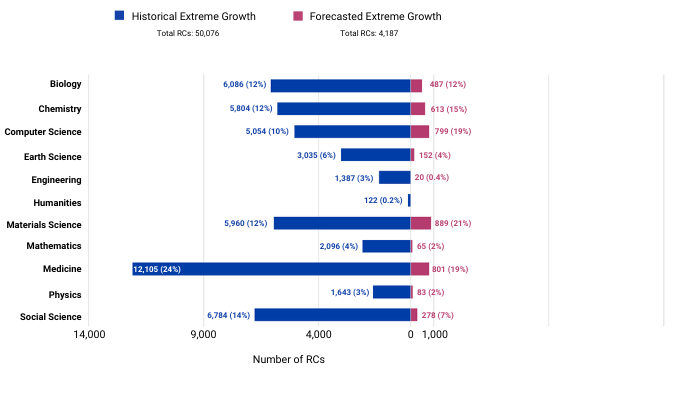
In our forecasting model, 8 percent growth or more is defined as forecasted extreme growth.3 For consistency, we consider historical growth of 8 percent or more to be historical extreme growth. Figure 1 displays a comparison of the number of RCs with historical extreme growth and forecasted extreme growth by their broad research areas. There is a noticeable scale difference between the two growth categories—there are 50,076 historical extreme growth RCs and 4,187 forecasted extreme growth RCs.
Figure 1. Percentage of RCs with historical extreme growth and forecasted extreme growth by broad research area

Note: Percentages are computed as the number of RCs in a given broad research area that meet the growth threshold divided by total number of RCs in the corresponding broad research area.
We find similar percentages of Biology, Chemistry, Earth Science, Engineering, Humanities, Mathematics, and Physics RCs among historical extreme growth and forecasted extreme growth RCs. But we find a higher percentage of Computer and Materials Science RCs and a smaller percentage of Medicine and Social Science RCs in forecasted extreme growth RCs compared to historical extreme growth RCs.
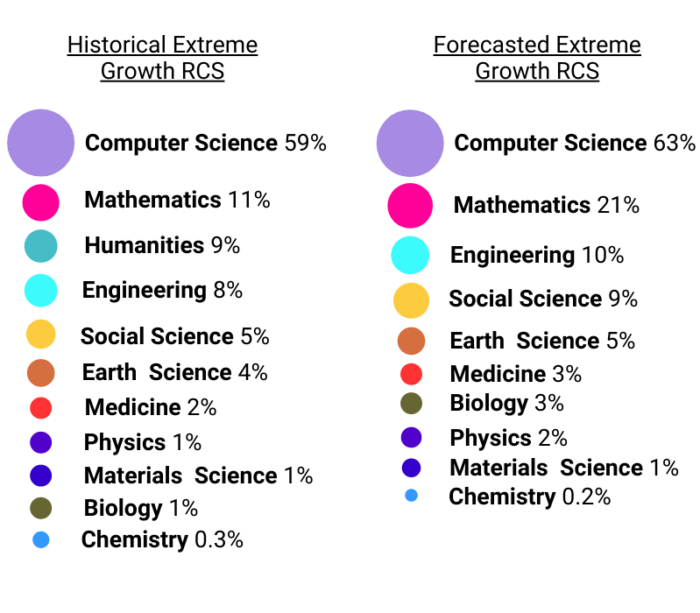
Next, we compare the difference between AI RCs in each extreme growth category. We select historical extreme growth and forecasted extreme growth RC subsets that have more than 10 percent AI-related papers, which includes RCs labeled as “Cross-disciplinary AI/ML research,” “Cross-disciplinary research with significant AI/ML contributions,” and “Advanced AI/ML research.”4 There are 4,124 historical extreme growth AI RCs and 597 forecasted extreme growth AI RCs. Figure 2 displays the percentage of AI RCs in each extreme growth category by broad research area. We find that both extreme growth categories have similar representation of AI RCs across broad research areas.
Figure 2. AI extreme growth RCs by research area

A comparison of AI-related RCs finds that Mathematics has a significantly higher percentage of RCs in forecasted extreme growth and Humanities has a higher percentage of RCs in historical annual growth; there are no Humanities RCs in forecasted extreme growth. All other broad research areas have similar RC percentages5 between the growth categories.
AI-related RCs forecasted to experience extreme growth over the next three years are a more selective subset of research, as forecasting growth considers more than just increases in publications. We can use RCs with forecasted extreme growth to analyze areas of research predicted to be the most active and developing at a high rate.
If you have questions about our methodology or want to discuss this research, you can reach us at cset@georgetown.edu.
Download Related Data Brief
Comparing the United States’ and China’s Leading Roles in the Landscape of Science- Autumn Toney, “Creating a Map of Science and Measuring the Role of AI in it” (Center for Security and Emerging Technology: June 2021) https://cset.georgetown.edu/publication/creating-a-map-of-science-and-measuring-the-role-of-ai-in-it/.
- Klavans, Richard, Kevin W. Boyack, and Dewey A. Murdick, “A novel approach to predicting exceptional growth in research” and Plos one 15.9 (2020): e0239177, https://cset.georgetown.edu/publication/creating-a-map-of-science-and-measuring-the-role-of-ai-in-it/.
- The 8 percent threshold is based on business portfolio analysis which uses 10 percent growth of actual revenue. Full details in Klavans, Richard, Kevin W. Boyack, and Dewey A. Murdick, “A novel approach to predicting exceptional growth in research” and Plos one 15.9 (2020): e0239177.
- Autumn Toney, “Locating AI Research in the Map of Science” (Center for Security and Emerging Technology, July 2021) https://cset.georgetown.edu/publication/locating-ai-research-in-the-map-of-science/.
- Within a 4 percent difference.
