After exploring CSET’s Map of Science in previous snapshots and demonstrating some ways to analyze the research in it, CSET is excited to present the public launch of the Map of Science user interface — allowing anyone to explore the Map and all of the research clusters (RCs) on their own. Below we describe the data updates to the Map of Science and walk through how to navigate the user interface.
Data Updates
We have incorporated two more datasets into CSET’s merged scientific publication dataset of scholarly literature: Papers with Code and arXiv. Additionally, we have added more documents from the Chinese National Knowledge Infrastructure (CNKI) to now include dissertations and publications from conferences, which has effectively doubled the number of Chinese publications.
User Interface
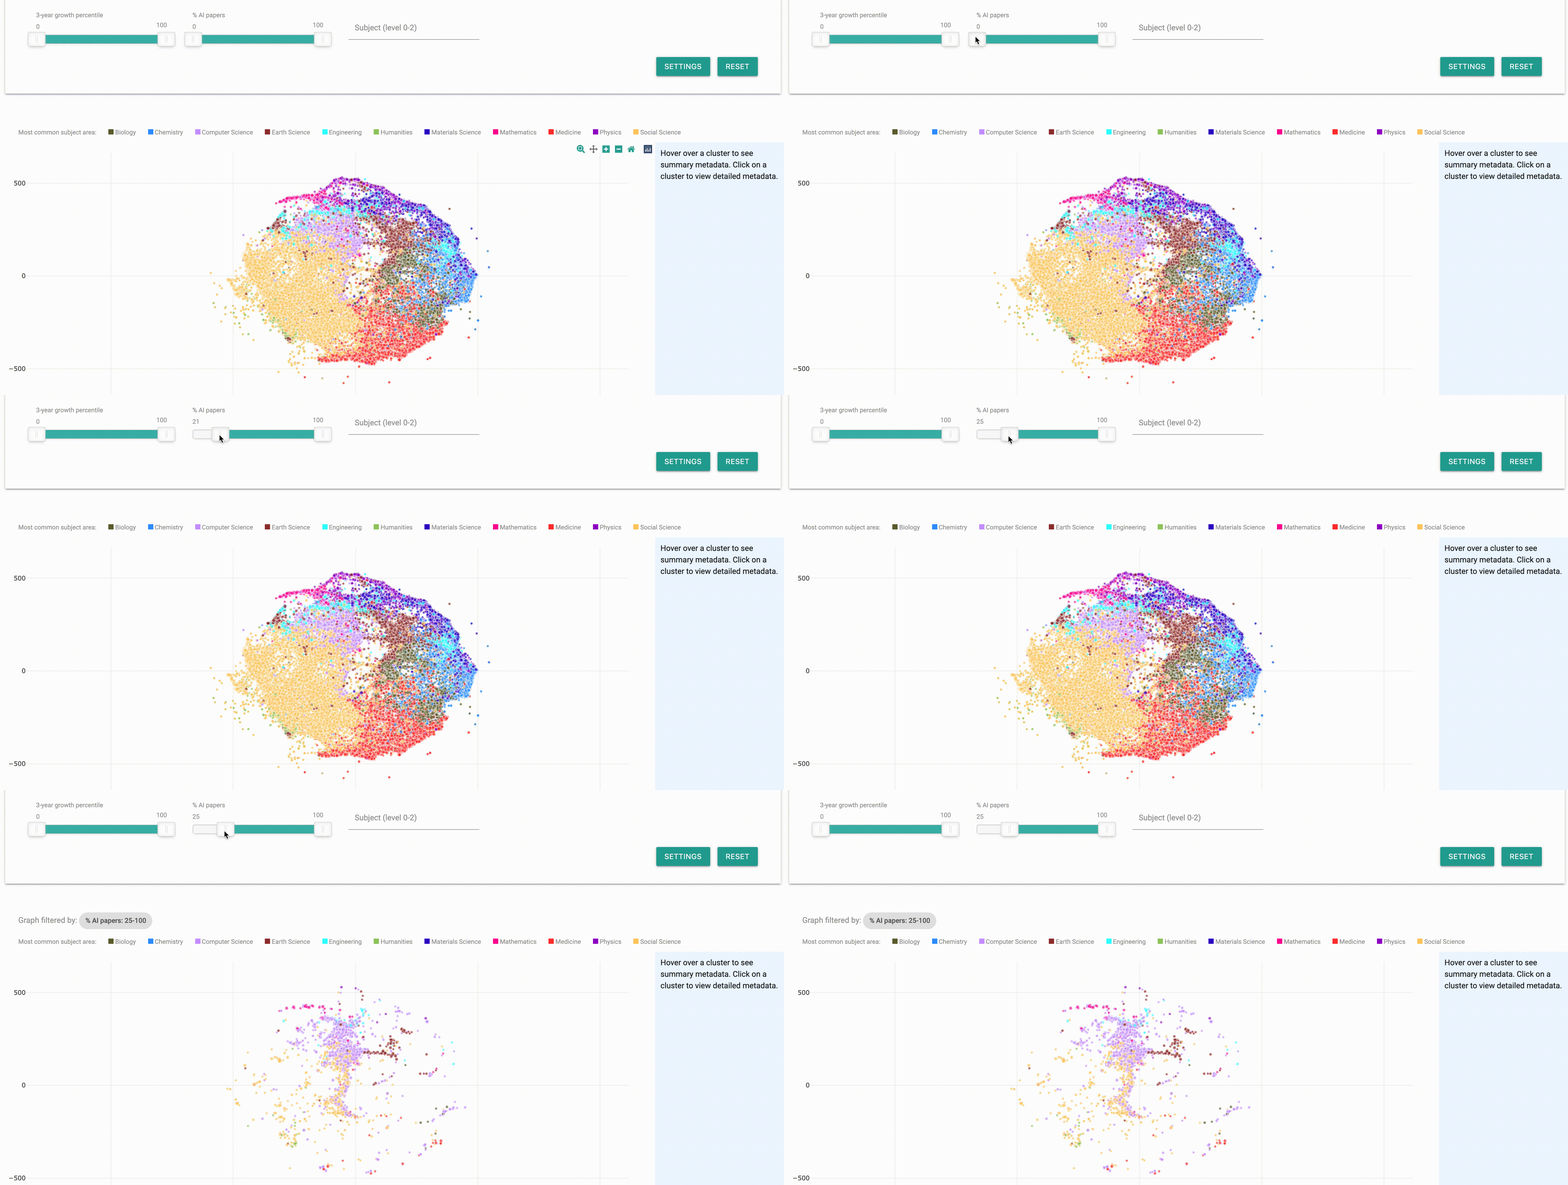
CSET’s Map of Science user interface provides 17 filters (e.g. subject, dominant country, growth, percentage of AI-related papers) to search through the Map and find RCs of interest. Figure 1 shows the result of filtering for RCs with 25 percent or more AI papers. In order to get the full list of filters, click on “Settings” and select “Select all”.
Figure 1. Using the “% AI Papers” Filter to Select RCs with 25% or more AI Papers
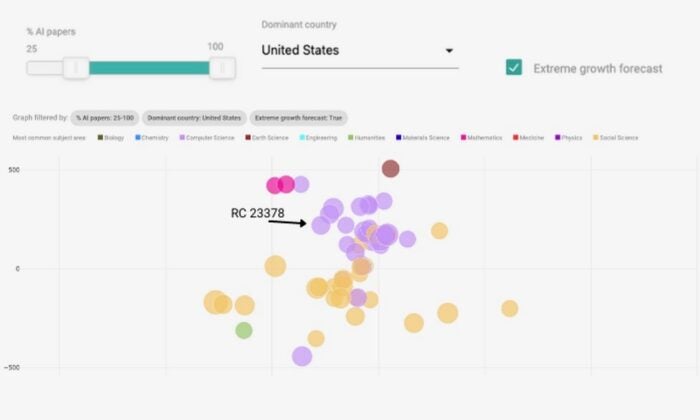
You can select multiple filters at once. For example, you can keep the 25 percent or more AI papers and add both the filters for RCs forecasted to have exceptional growth by checking “extreme growth forecast” and for RCs where the United States is the most common author-affiliated country by using the “dominant country” filter and selecting the United States. Figure 2 shows the resulting RCs after applying all three filters, automatically zoomed in to the filtered RCs.
Figure 2. Filtered RCs by % AI Papers, Dominant Country, and Growth
Once you’ve filtered for RCs of interest, you can hover over individual RCs (represented by dots on the Map) to see the RC numerical ID and a quick overview of RC stats. You can click on individual RCs of interest to open a new window with a full page of details that contains a summary of the research in the RC, a list of the key (including core and most cited) papers in that RC, and information on the most active countries, authors, and organizations in that RC.
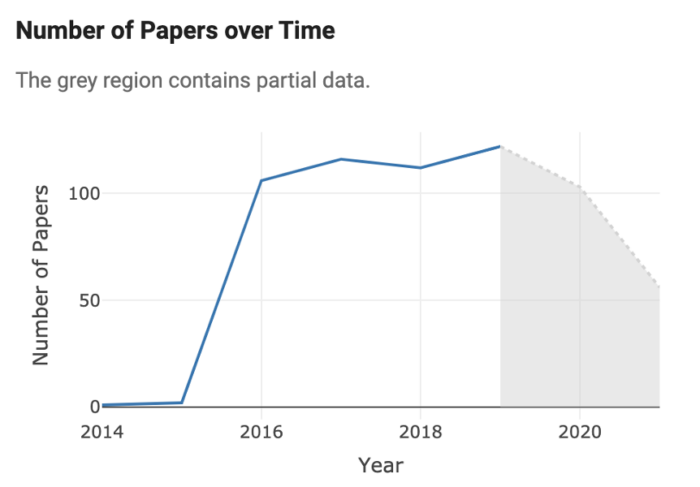
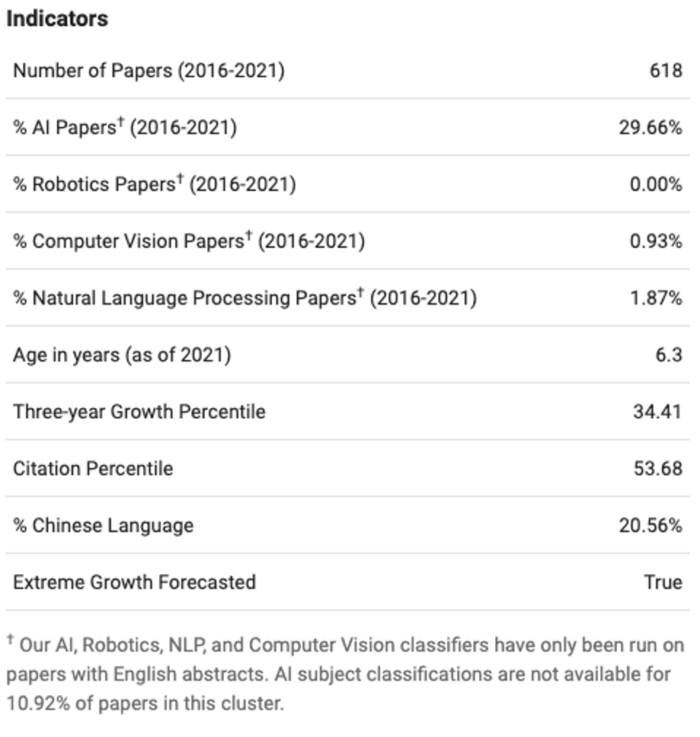
As an example, we selected RC 23378 (this RC is selected with the filters mentioned above and is displayed in Figure 2). On the “Summary” tab, we see features such as most common RC subject labels, nearest neighbor RCs, and the number of new publications by year (shown in Figure 3).
Figure 3. RC 23378 Number of Papers Over Time and RC Indicators
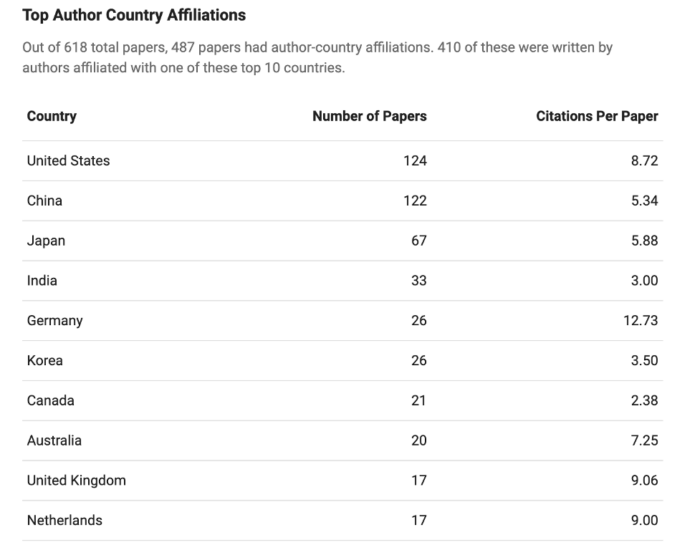
By selecting the “Papers” tab, we can look through a list of core, highly cited, and review papers, which enables us to see the types of research that this RC is focused on. RC 23378 focuses on malware detection and malicious JavaScript; see an example core paper here. Lastly, if we select the “Country and Organizations” tab, we can see the top author country affiliations and funding organization locations, as well as the top author’s organizational affiliations and funding organization types and names. Table 1 displays the top author country affiliations table for RC 23378, which provides the number of papers for each of the top authors’ countries of affiliation and the average number of citations per paper for papers affiliated with those countries.
Table 1. RC 23378 Top Author Country Affiliations
There is lots more to explore, so check out the Map of Science yourself here! For more information on how to navigate the interface, you can watch a CSET data scientist walk through some commonly used Map features in this video. We are eager for feedback from users, so please reach out with any questions or suggestions using the feedback button on the interface or by emailing cset@georgetown.edu.