Multilayer perceptron? Autoencoder? Deep learning? It can be challenging to identify a keyword list that is comprehensive and stable enough over time to select relevant data for answering research questions. What is happening in deep learning research? How is it impacting other research areas? How will deep learning be applied across domains? In this snapshot, we share a new approach to mapping connections across research areas and informing questions like these by using a keyword list in concert with the Map of Science. To explore a specific research area like deep learning, one might start with a small set of keywords to identify a subset of relevant publications and draw conclusions from the resulting analysis. However, we know that the corpus of publications will be incomplete, as developing stable, comprehensive keyword lists that maintain relevance over time is extremely challenging.
Below, we illustrate a step-wise visualization approach that leverages keywords as a starting point to identify relevant research clusters within the CSET Map of Science, which is derived from CSET’s merged corpus of scholarly literature.1 Note that the analysis presented here is done on the underlying merged corpus data, and cannot be replicated directly in the Map of Science interface.
We first identify research clusters with a high concentration of publications that contain our keywords, and we create a “keyword concentration plot.” This provides some broader context, including publications that are highly related but may not use the specific keywords. We then visualize the dominant links between these clusters using what we call a “keyword cascade plot.” This plot enables exploration of research cluster impact across time and identification of the broader set of related work; plus, because research clusters are quite stable over time, we can track and compare these dynamics into the future.
Step 1: Identifying a corpus of publications using keywords
In order to identify research clusters of interest based on a set of keywords, we must first create a corpus of publications that mention the keywords. For our example of deep learning, we search through publication titles and abstracts for the phrases “deep neural network” and “convolutional neural network.” If a publication mentions at least one of these phrases, we add it to our deep learning corpus.
Example SQL code to search for “deep neural network” and “convoluted neural network”
Our output at this step is a list of publications — our keyword corpus.
Step 2: Link keyword publications to research clusters
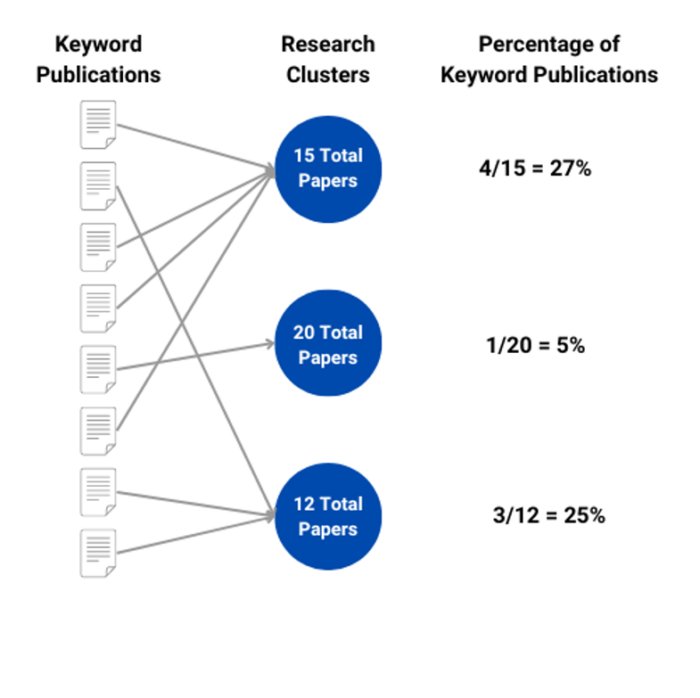
We link publications from our keyword corpus to their research clusters, as the keyword cascade plot relies on cluster-level data. The research clusters enable us to identify a more comprehensive set of deep learning-related research. We do this by computing the percentage of keyword corpus publications in each cluster.
Figure 1. Percentage of Keyword Publications Per Cluster

Our output at this step is a list of research cluster IDs and the percentage of their publications that feature our deep learning keywords (a.k.a., publications from the keyword corpus).
Step 3: Select research clusters to plot
Using these percentages, we sort the research clusters to identify those with the highest concentration of relevant publications. How many research clusters to plot can be decided by choosing either 1) a set number of clusters (e.g., top 10 clusters); or 2) a percentage threshold (e.g., select all clusters with 50% or more keyword publications). In our example, we choose the top 20 clusters.
This selection step is open to iteration. Some topics with smaller sets of relevant research clusters may only need 10. In cases where you are looking for outliers or unusual applications of a technical approach that may just be emerging, you might look at 100. Additionally, the sorting approach that we take is not required. Depending on the analysis, a different selection criteria can be applied based on the various aggregated metadata features of research clusters (e.g., fields of study, leading country, percentage of AI publications).
Once the plot is generated and goals are agreed upon, it will be easier to assess an optimal selection criterion.
Our output at this step is a set of research clusters to plot.
Step 4: Generate count and citation link data by year
Here, we want to create the input for the keyword cascade plot. The plot shows the growth in, and citation links between, identified deep learning keyword publications across clusters by year. We use 2010 as the starting year and 2021 as the end year. For the 20 research clusters, we calculate how many keyword publications in a given research cluster and year cite other keyword publications in different clusters across the years.
This table only contains links for publications with at least four links for the year in order to highlight only links of a certain “strength” (i.e., if there is only one link between clusters for a given year, then we do not display it). We also remove links from the same cluster to itself across the years to eliminate the display of connections over time within a research cluster. These choices can be modified if the goal is to find “weaker” links, though some additional manual analysis would be needed.
This results in our final data output, a table that contains the following for each research cluster:
- Number of total publications by year;
- Percentage of keyword publications in each research cluster by year; and
- Number of links between keyword publications across research clusters and years.
Step 5: Generate keyword concentration plot
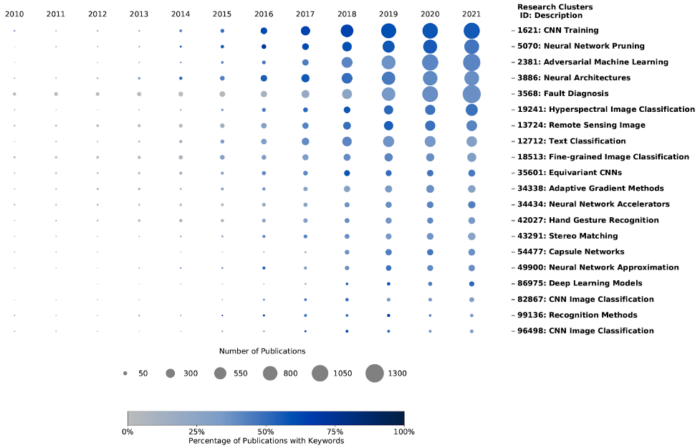
Now we are ready to generate an initial keyword concentration plot. We plot only the first two features of our result table (total number of publications and percentage of keyword publications by year and research cluster) as a keyword concentration plot. Figure 1 displays the top 20 research clusters containing deep learning keyword publications. Each node is colored by the percentage of keyword publications in that cluster and year. The size of the node represents the total number of publications in that cluster from the given year. This shows, for example, that the number of publications in research cluster 2381 (research on adversarial machine learning, third row in Figure 1) has grown each year (growing size of the circle), and the percentage of publications containing the keywords has remained roughly constant (same shade of blue over time). At times, this simplified version may provide clarity and illustrate the trends needed for analysis.
Figure 2. Deep Learning Keyword Concentration Plot

Step 6: Generate final keyword cascade plot
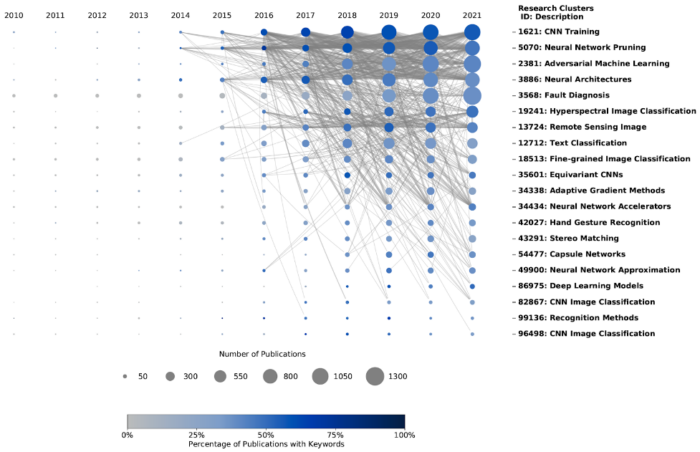
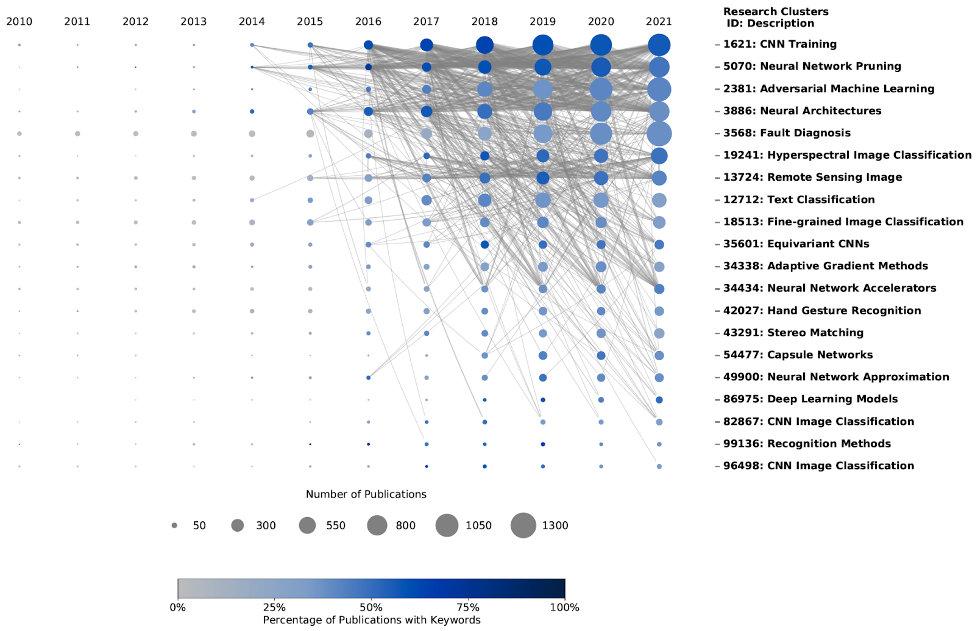
Next, we add in the citation and reference links between keyword publications. Figure 2 displays the final deep learning keyword cascade plot. The links show relationships between different research clusters over time through references (i.e., research publications authors are building their research on) and citations (i.e., the research publications that others are producing leveraging the original authors’ work). Building on the adversarial machine learning example, the keyword cascade plot shows that it is one of the most heavily connected research clusters relevant to our keywords.
Figure 3. Deep Learning Keyword Cascade Plot

At this point, it is possible to leverage the keyword cascade plot to understand the landscape of research around selected keywords and explore the groups of publications that are of most value to the analysis in question. Research clusters of interest will vary based on analytic goals. Examples include clusters that are continuing basic work in a given area, clusters that are being drawn on to improve that work, or clusters that are drawing on that work for specific applications. Additionally, clusters that have geographically specific leadership or keywords of specific interest in the application space could direct your choice. Either way, this helps the analyst expand beyond the limitations of keywords to the larger communities of publications that are relevant to the research.
In a future data snapshot, we will select several example research clusters from our deep learning keyword cascade plot that highlight interesting interactions and further analyze their reference and citation linkages across research clusters.
- CSET’s merged corpus of scholarly literature includes Digital Science’s Dimensions, Clarivate’s Web of Science, Microsoft Academic Graph, China National Knowledge Infrastructure, arXiv, and Papers With Code. Data is sourced from Dimensions, an inter-linked research information system provided by Digital Science (http://www.dimensions.ai). All China National Knowledge Infrastructure content is furnished for use in the United States by East View Information Services, Minneapolis, MN, USA.
