This is the second installment of a three-part data snapshot series. Read Part 1 & Part 3.
Commercial retailers have long sought to boost profits using the so-called “loss leader” strategy, which involves selling certain products at a loss to bring in customers that go on to purchase other, more profitable items. Perhaps the best-known practitioner of this tactic is Costco—the store has not changed the price of its rotisserie chicken for more than a decade, and its food court’s famous hot dog combo has cost just $1.50 since the mid-1980s. (Costco co-founder Jim Sinegal once told the company’s then-CEO, “if you raise the effing hot dog, I will kill you.”)
Over the last decade, some large tech companies—most notably cloud providers like Amazon, Alphabet, and Microsoft (hereafter the “Big Three”)—appear to be adopting a similar approach with open-source software (OSS) tools. By developing and promoting these free software packages, the companies can draw users into their cloud services ecosystems and turn them into paying customers.
The strategy works something like this: developers gravitate toward OSS tools because they provide free, scalable, out-of-the-box solutions that can be deployed faster and more easily than custom code. The Big Three spend time and resources building a wide array of OSS packages for the cloud and releasing them to the public through platforms like GitHub. However, because these packages are tailor-made to each company’s particular cloud environment, the developers who want to use them must join the company’s cloud platform. Eventually, developers get comfortable using the company’s particular tools and cloud environment, and they become less inclined to switch to a different cloud provider and learn a new set of tools. (This “lock-in” effect is likely even stronger among developers who participate in the companies’ workforce training programs.)
To understand how the Big Three have pushed into the open-source software ecosystem in recent years, we analyzed data from GitHub, the leading global repository for OSS tools. Alphabet (Google Cloud Platform/GCP), Amazon (Amazon Web Services/AWS), and Microsoft (Azure) each offer open packages through GitHub profiles dedicated to their cloud ecosystems: ‘GoogleCloudPlatform’, ‘aws’, and ‘Azure’, respectively. Using GitHub’s API, we analyzed the repositories associated with these profiles, along with key metadata about popularity and usage. These packages cover a wide range of application areas, including cloud instance templates, command line tools, AI/ML pipelines, and device management systems.
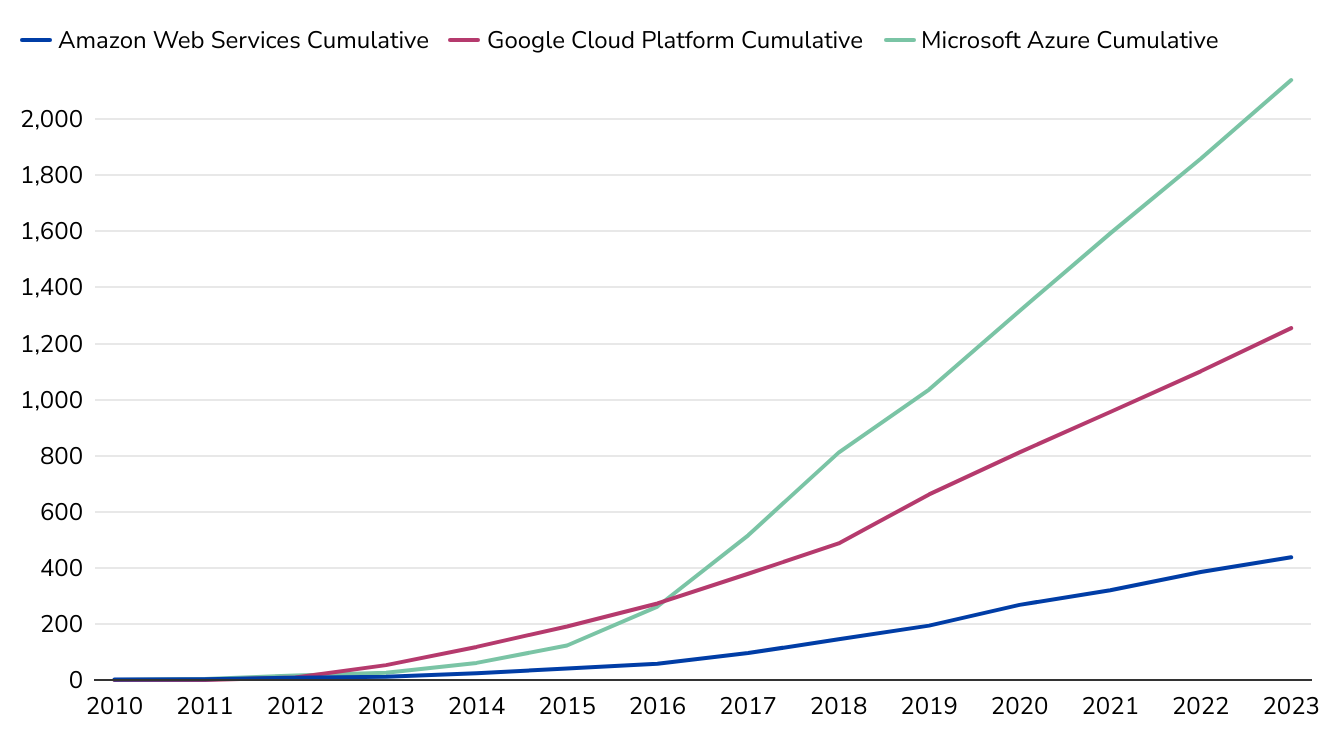
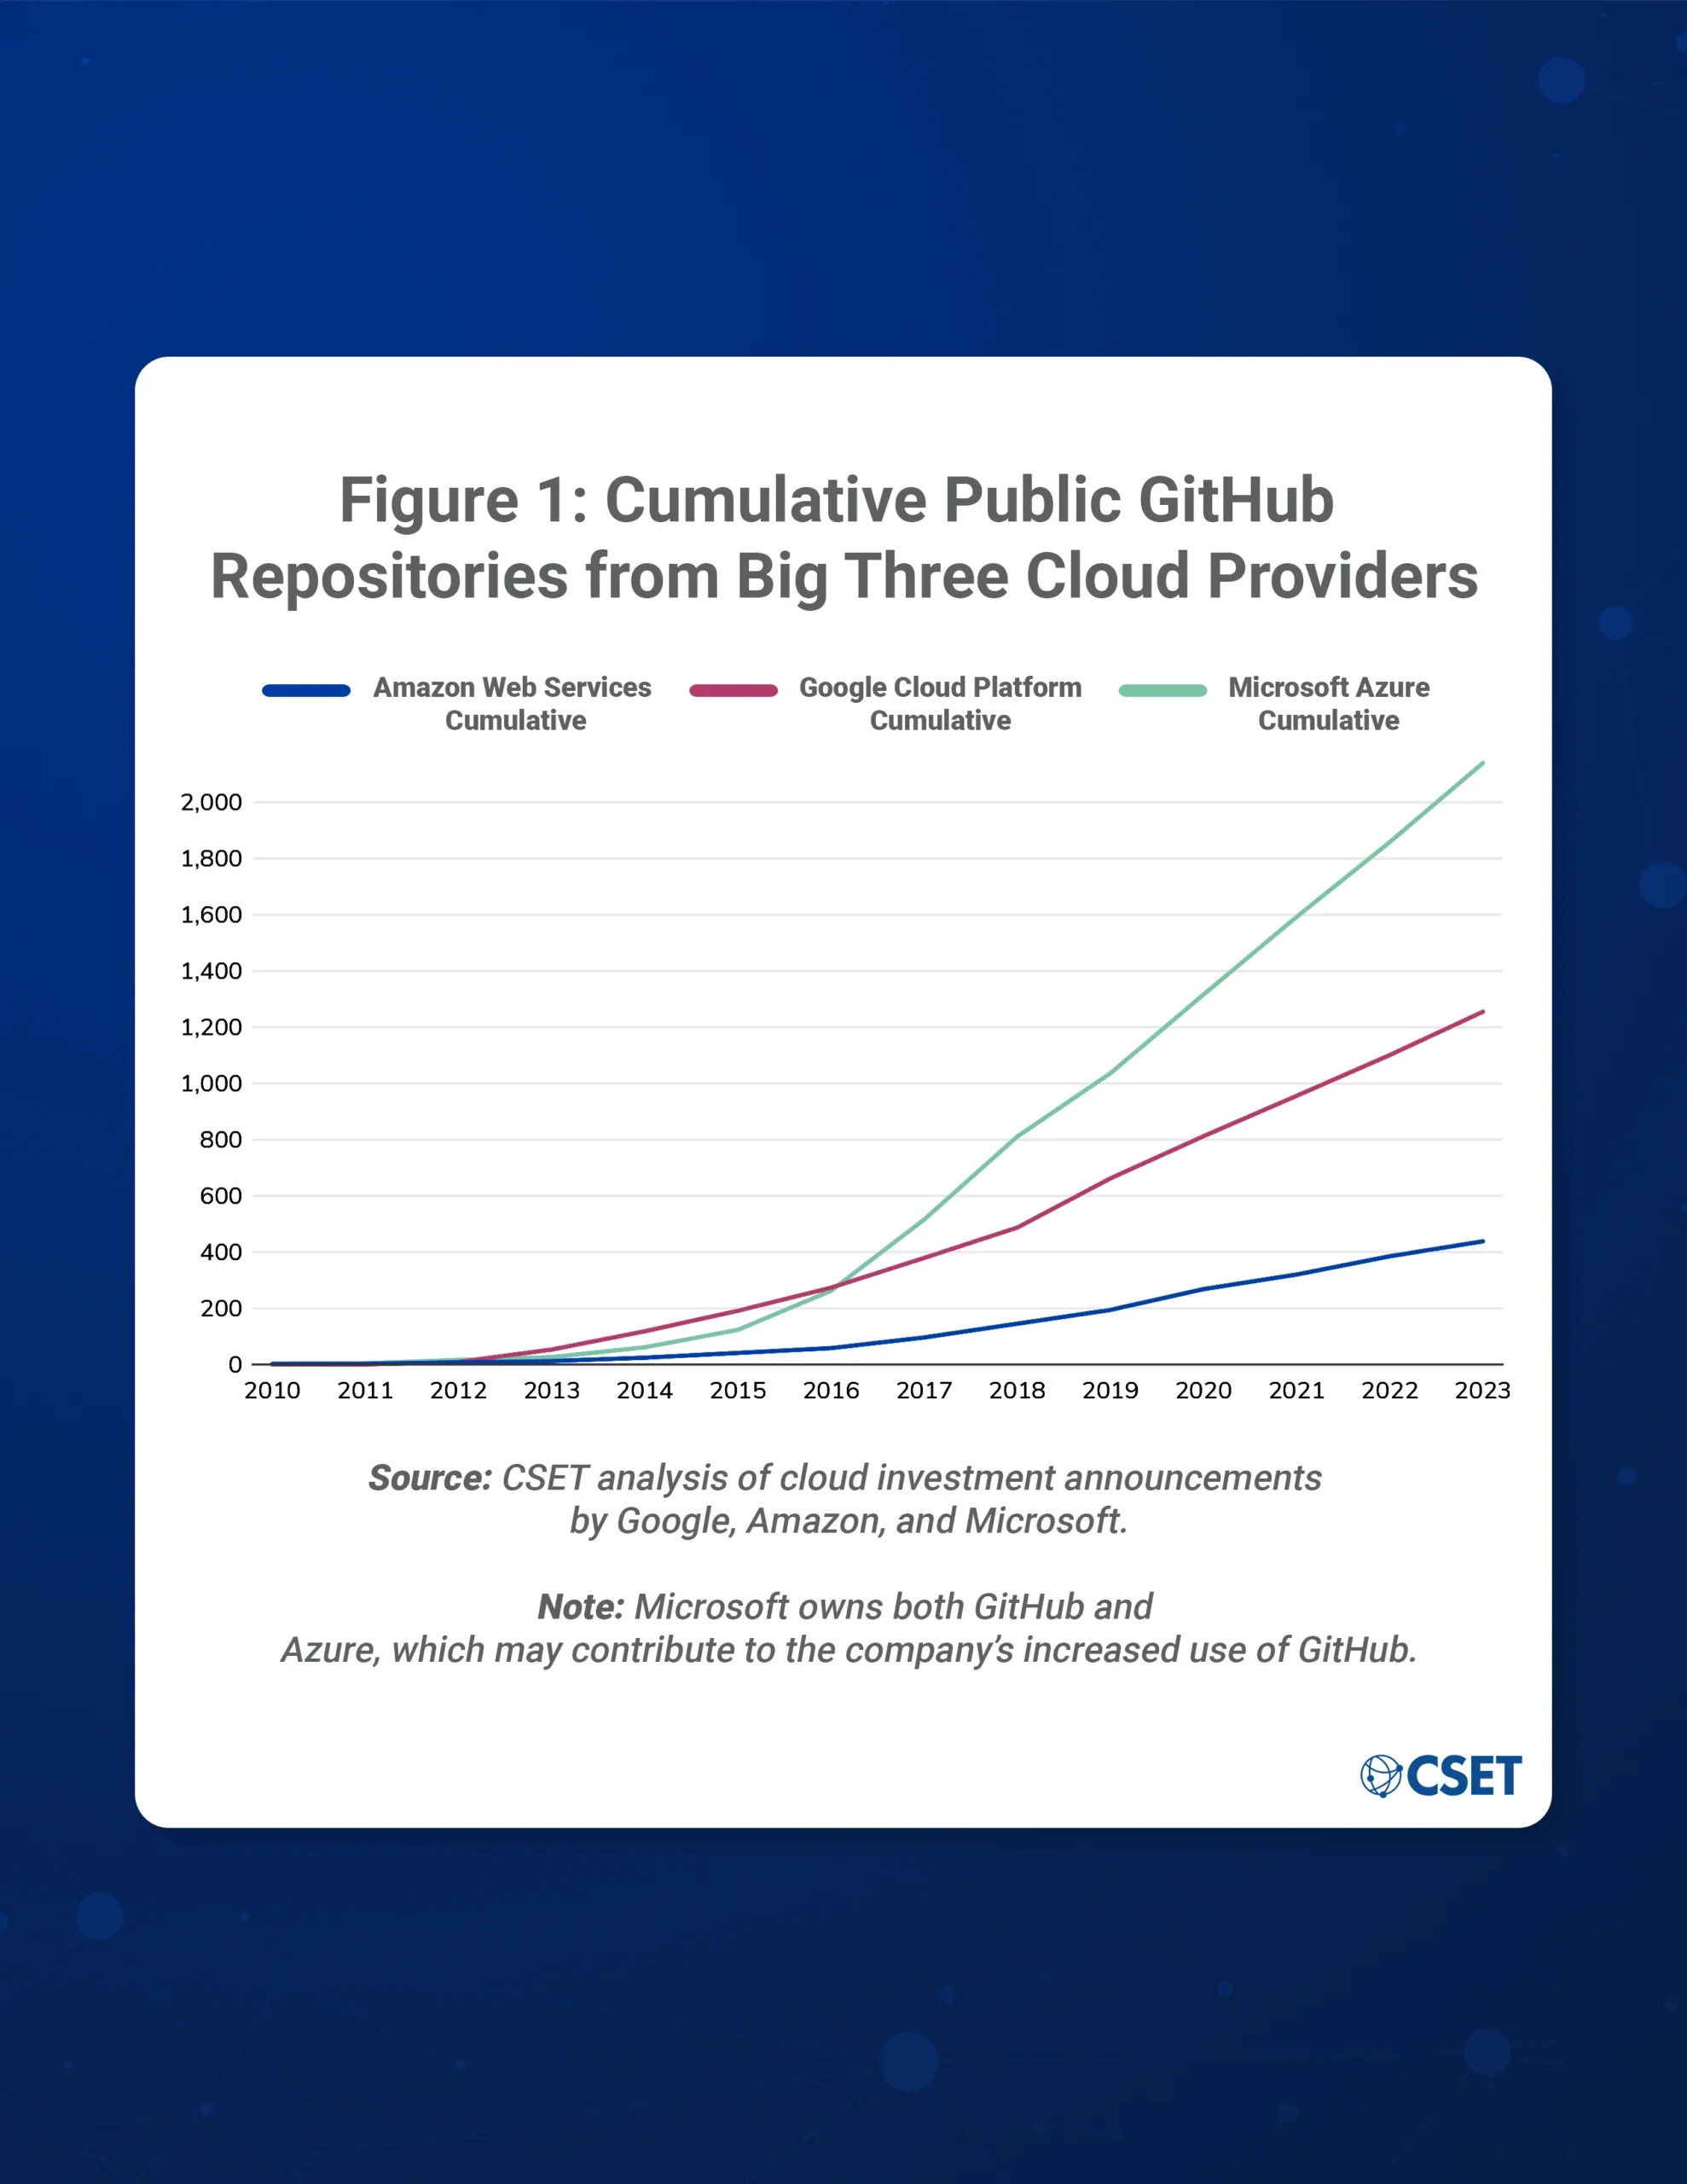
Our analysis found that since 2010, the Big Three have collectively made over 4,000 OSS tools freely available to developers. As shown in Figure 1, Microsoft (Azure) has developed the most OSS tools over this period, releasing a total of 2,279 repositories since 2010. The rate of these releases increased sharply in 2015 shortly after Satya Nadella, an outspoken proponent of open-source software, took over as the company’s CEO. Although AWS leads the cloud computing market, it has the fewest publicly available GitHub repositories among the Big Three. One possibility for this apparent discrepancy is that as the incumbent industry leader, AWS may not view open-source software as necessary for attracting customers. Amazon appears to favor integrating software tools directly into user applications rather than requiring users to adapt OSS packages. Alphabet (GCP) offers a comparatively large suite of OSS tools for its cloud ecosystem, perhaps reflecting an effort to expand its slice of the cloud computing industry.
Figure 1: Cumulative Public GitHub Repositories from Big Three Cloud Providers

Note: Microsoft owns both GitHub and Azure, which may contribute to the company’s increased use of GitHub.
Creating OSS repositories is only the first step of the “loss leader” strategy. If companies want these tools to drum up new business, developers need to use them. To understand how popular these various repositories are among developers, we analyzed their “stargazers,” the number of users who “like” a particular repository on GitHub. Figure 2 displays the total and average number of stargazers, along with the amount that the top 5% of repositories for AWS, GCP, and Azure GitHub account for. Given that the distribution of stars tends to center around a small number of highly popular repositories, this last column provides context into how concentrated the user-based activity is (the top repositories account for more of the user-based activity), or how distributed it is (the top repositories account for less of the user-based activity).
Figure 2: Total and Average Stars for Big Three Cloud Provider GitHub Repositories

Despite having the fewest open GitHub repositories, AWS repositories have more total stargazers and the highest average number of stargazers compared to GCP and Azure repositories. Azure has a similar number of total stargazers as AWS but with five times as many packages. However, all three providers see a relatively equal concentration of stars among their top 5% of repositories. This suggests users focus their stars among the top repositories at a similar rate across all three providers, regardless of the disparities in total or average stars.
Another metric of repository popularity is the number of “forks.” Forks occur when a user copies a repository either to adapt it to their own purposes or interest, which suggests a higher level of user engagement than a “star.” Figure 3 displays the total number of forks across repositories and the average forks per repository, and again the coverage that the top 5% of repositories account for.
Figure 3: Total and Average Forks per Big Three Cloud Provider GitHub Repositories

Azure leads in terms of the total number of forks across its repositories, but this is perhaps unsurprising given that Microsoft offers significantly more repositories to users. AWS leads in terms of average forks per repository. Compared to stars, we see more variation in forks among the top 5% of repositories of all three companies, suggesting that “forking”—as an indicator of use and adaptation by developers—is happening more consistently across AWS’ repositories.
Another way to measure the popularity of a given repository is through “issues” activity. On GitHub, issues act as a community messaging board where users can ask questions, submit bugs, or suggest improvements to the repository owners. A repository with a highly active user base would have an active issue board. Figure 4 shows the community engagement for Big Three cloud repositories through issues.
Figure 4: Total and Average Issues per Big Three Cloud Provider GitHub Repositories

Again we see evidence that although AWS provides the fewest number of GitHub repositories, those repositories have an active user base, with the highest average issues per repository. Azure leads in the total number of issues but falls in the middle with an average of 24 issues per repository. Additionally, the top 5% of Azure repositories account for 70% of its issues, meaning most of the user issues are concentrated on key repositories. GCP lags behind both AWS and Azure here, both in terms of the total number of issues and the average number per repository, but boasts the highest percentage of issues outside its top 5%.
These three user-based popularity metrics provide key insights into whether OSS users are fully leveraging the full suite of offered OSS tools. All three providers see high total stars—the easiest form of engagement—and roughly equal concentration amongst the top 5% of repositories. When viewing popularity metrics that require more effort from users—the forks and issues—Azure leads in terms of total engagement. However, this engagement is concentrated in its top 5% of repositories, whereas the users of AWS and GCP engage all the tools offered more often.
Our analysis of the Big Three’s open-source software repositories makes it clear that the companies are developing OSS tools, and developers are engaging with those packages. While AWS controls the largest share of the global cloud market, both GCP and Azure offer more OSS tools, potentially in an effort to attract more developers to their cloud environments. AWS’s dominant role in the industry is underscored by the rates at which developers engage in its open-source repositories in GitHub, but GCP and Azure each have sizable cohorts of users interested in and engaging with their full suite of tools, as evidenced by the analysis of forks and issues on their repositories. This developer engagement can lead to new business for the Big Three when—not if—they need cloud computing resources or consulting services. As open-source software becomes increasingly prevalent in both cloud computing and the AI community, monitoring how the Big Three develop and distribute OSS tools will provide critical insight into their strategies for building and welding market power.
