Early results suggest crowd forecasting might be an effective tool for identifying whether metrics—trends for which we have historical data—will deviate from their historical trajectories. This post analyzes crowd forecasts for the 16 metrics-based forecast questions on Foretell that have resolved. Specifically, we look at whether the crowd effectively forecasted trend departures, meaning the extent to which the actual result deviates from a projection based on historical data (projection).1 The trend departure measure is standardized to allow for direct comparisons across metrics.
We find that the crowd’s mean error (0.34) was significantly lower than that of the projection (0.56). Viewed differently, the crowd outperformed the projection on 50 percent of the metrics; the projection outperformed the crowd on 19 percent of the metrics; and the two functionally tied on the remaining 31 percent of the metrics.
We believe this method could improve policymaking. Trend departure is, in effect, a measure of how surprised we should be. Our goal is to combine the distinct advantages of quantitative and crowd forecasting to anticipate such surprises. The result would be a tool that automatically flags where and to what extent the policymaking environment is shifting in ways that might bear on policy decisions.
Illustration: U.S.-China Trade
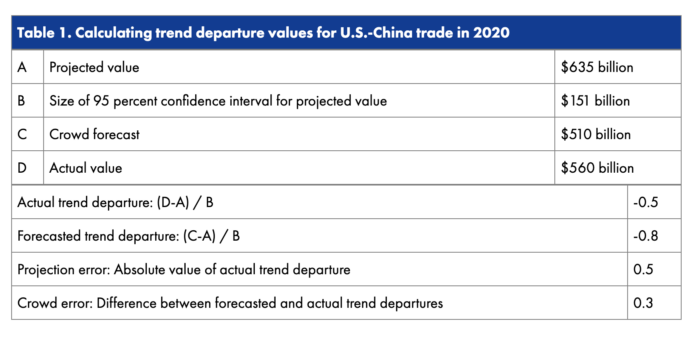
To see how it works, consider the example in Figure 1 of U.S.-China trade in 2020. After eliciting crowd forecasts for this metric, we assessed the crowd’s accuracy by comparing its mean forecast ($510 billion) to the actual value ($560 billion) and the projection based on historical data ($635 billion). The further a value—whether actual or forecasted—is from the projected value, the greater its trend departure. To allow for comparisons across metrics with different levels of volatility, the trend departure measure is normalized to the 95 percent confidence interval for each metric’s projection.
We then create trend departure categories for simplicity. For U.S.-China trade in 2020, the size of the 95 percent confidence interval is $151 billion. If the trend departure is less than 30 percent of the confidence interval ($45 billion in this example), it’s in the no trend departure category. If the trend departure is between 30 percent and 100 percent of the confidence interval ($45 to $151 billion in this example), it’s in the moderate trend departure category (+ or -). And if the trend departure is greater than 100 percent of the confidence interval (greater than $151 billion in this example), it’s in the large trend departure category (+ or -).2
Finally, we compare the actual trend departure with the crowd’s forecasted trend departure. In this example, the crowd forecasted that the value of U.S.-China trade in 2020 would be $510 billion, or $125 billion below the projected value. After dividing that value by the size of the projection’s confidence interval ($151 billion), we get a forecasted trend departure value of -0.8. In fact, U.S.-China trade in 2020 was $560 billion, or $75 billion below the projected value, which yields an actual trend departure value of -0.5. The difference between the two—0.3 in this example—is the crowd error. Table 1 provides a summary of this example.

Results3
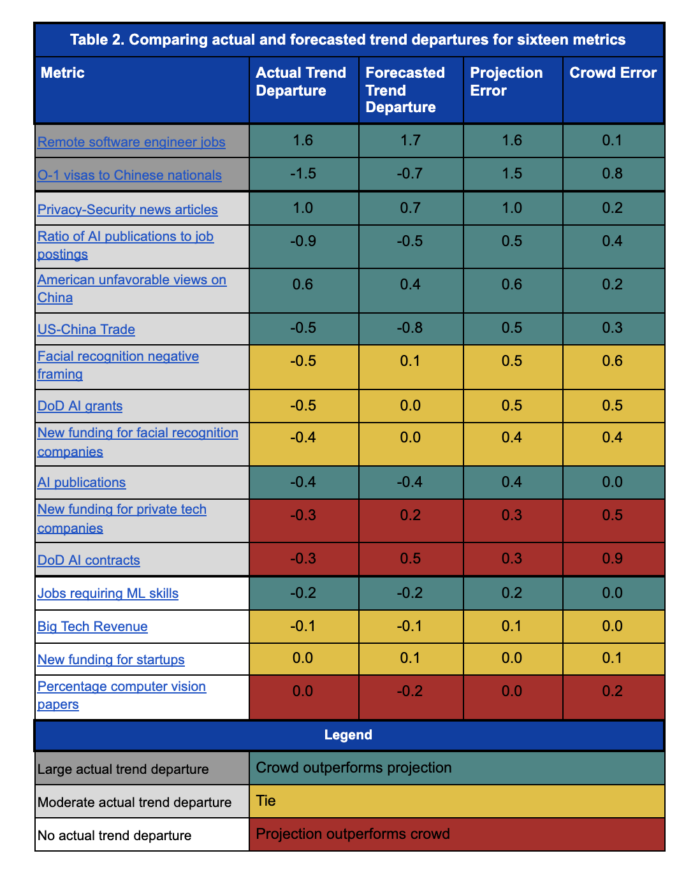
Table 2 shows the actual and forecasted trend departures for all 16 metrics, grouped by their trend departure categories. Two metrics have large trend departures (+ or -): the percentage of software engineer jobs that would allow for remote work; and the percentage of O-1 visas that would go to Chinese nationals. Ten metrics have moderate trend departures (+ or -); and four metrics have no trend departure.
We show the crowd’s accuracy in Table 2 by comparing the mean crowd forecast to the projection. We do this in two ways:
One approach considers all metrics together and compares the mean projection error with the mean crowd error. By this measure, the crowd significantly outperformed the projection: the crowd’s mean error is 0.34 and the projection’s mean error is 0.55.
A second approach compares the crowd and projection on a question-by-question basis. In Table 2, we score each question as a win for the crowd (green cells), a win for the projection (red cells), or a tie (yellow cells). A question is a tie if the difference between the crowd and projection error is less than 0.1. By this measure, the crowd again significantly outperformed the projection: the crowd outperformed the projection on 50 percent (8/16) of the metrics; the projection outperformed the crowd on 19 percent (3/16) metrics; and the two approaches tied on 31 percent (5/16) metrics.

Notably, four of the crowds’ biggest misses have common features: two are about Department of Defense spending on AI, and two are about whether facial recognition will become more prominent and controversial. The crowd incorrectly believed that DoD spending on AI—contracts and grants—would be significantly above the projection, and it was in fact below the projection. And the crowd incorrectly believed that funding for facial recognition companies and controversy regarding facial recognition in the media would remain on their historical trajectory, whereas both significantly declined.
Conclusion
These results suggest that the combination of projections based on historical data and the wisdom of the crowd might be more accurate than the projections alone. We didn’t see evidence that the crowd generally accorded either too much or too little deference to the projection.
We also found the errors informative, as they highlight where conventional wisdom is wrong. As discussed above, the crowd incorrectly believed that DoD spending on AI would increase and that facial recognition would be a bigger deal—in terms of funding and controversy—than it has been.
These results should be treated with caution, however, for several reasons: (i) the sample size is small; (ii) the forecasts covered time periods of different sizes; and (iii) for some questions, the questions were live during part of the forecast period, and it’s possible some forecasters considered data for that time period when forecasting.4 Going forward, we will close questions before the time period being forecasted begins, to avoid this problem.
- The projections are made using the AAA ETS exponential smoothing algorithm. We describe the trend departure methodology in greater detail in Page et al., Future Indices (2020).
- The boundaries of these categories are arbitrarily selected.
- The underlying data is here.
- For questions where the risk of point three seemed particularly high, we also calculated the crowd forecast at an earlier date, before some or all of the data relevant to the forecast question was available. In all cases we checked, the difference was immaterial.